New Jersey Wetlands
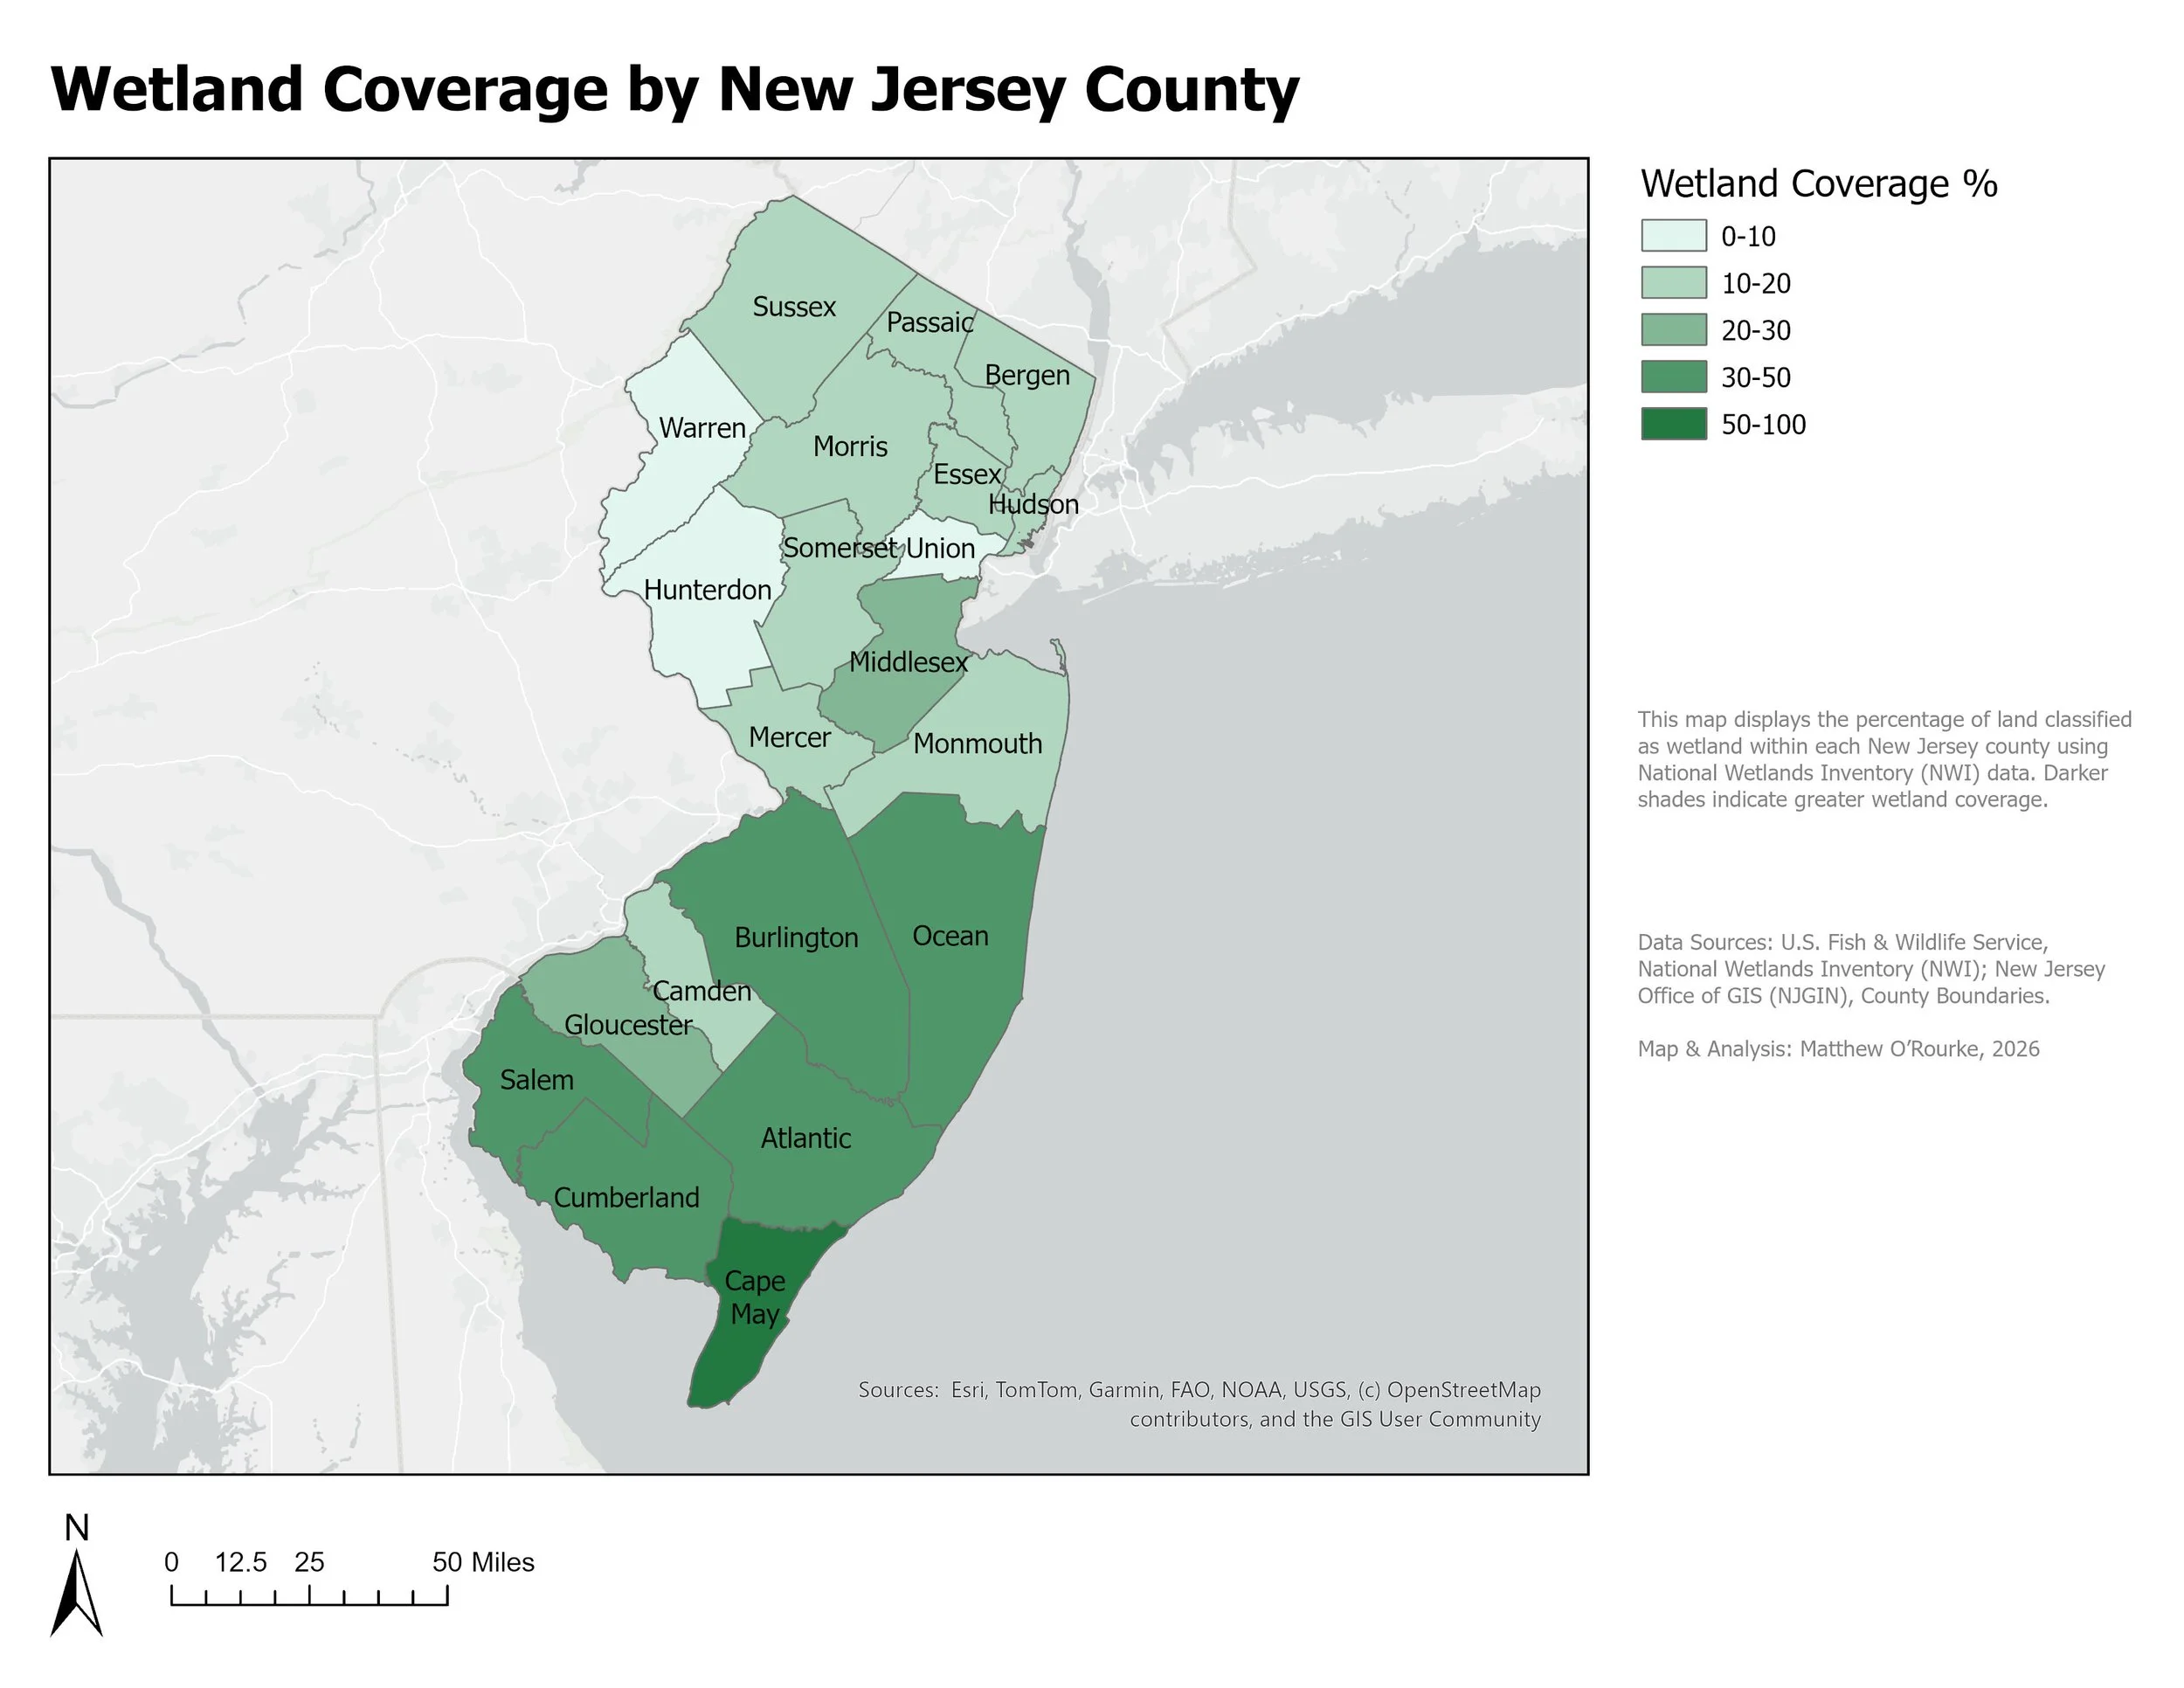
Comparing the percentage of land classified as wetlands across New Jersey’s 21 counties.
About the Project
As a New Jersey native with a background in environmental science, I wanted to learn more about the ecology of my home state and how it varies geographically. Wetlands were a natural place to start because of their ecological importance and the diversity of wetland environments found throughout New Jersey. I was especially interested in seeing which counties have the greatest proportion of wetlands, both from an environmental perspective and to identify areas I might want to visit and explore myself.
This was also my first GIS project after some time away from mapping. I wanted to start with a relatively simple but meaningful analysis that would help me refresh my GIS skills while producing a map that clearly communicates an environmental pattern.
Process
I created the map in ArcGIS Pro using wetland data from the U.S. Fish & Wildlife Service National Wetlands Inventory (NWI) and county boundary data from the New Jersey Office of GIS (NJGIN). I used spatial geoprocessing to intersect wetland polygons with county boundaries, calculated wetland area within each county, and normalized those values by total county area to determine percent wetland coverage. I then classified and symbolized the results to show how wetland coverage varies across the state before creating the final map layout.
What I Learned
This project helped me refresh and build on my ArcGIS Pro skills, including working with geodatabases, spatial intersections, geometry calculations, summary statistics, attribute calculations, and graduated symbology. I also spent time improving the cartographic side of the project—choosing an appropriate basemap and color scheme, simplifying labels, designing a clear legend, and arranging the final layout so the data is easy to interpret.